
Unlock Your Financial Insights with Biztrak Online Dashboard Module

SAGA Government Agencies Conference 2023 (SeGAC 2023)
June 15, 2023Release of Biztrak MSB 16.0 Service Pack #4 SP#4 EBF#1 (16.0.4.1)
June 16, 2023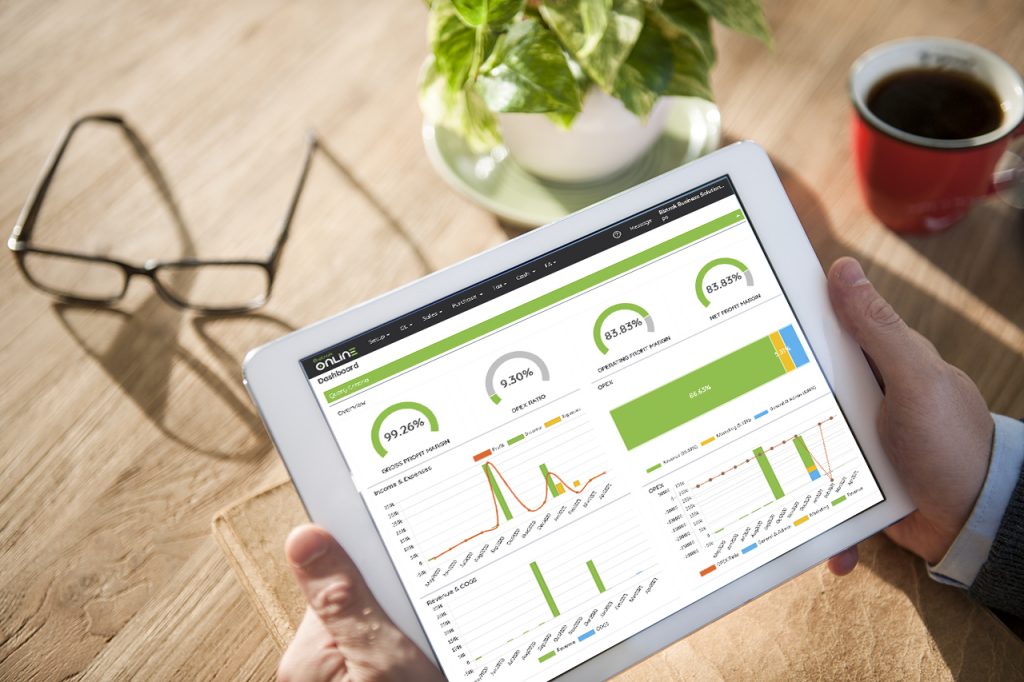
Unlock Your Financial Insights with Biztrak Online Dashboard Module
The Dashboard module in Biztrak Online Cloud Accounting (Biztrak Online Dashboard) is a visual display of important financial information and key performance indicators (KPIs) in a consolidated and easily understandable format. It serves as a centralised hub where users can access and monitor essential financial data, such as revenue, expenses, profitability, and other relevant metrics.
The Biztrak Online Dashboard includes charts, graphs, and tables that display real-time or up-to-date information, allowing users to track financial performance, identify trends, and make informed decisions. It provides a snapshot of the company's financial health and helps users analyse and interpret data quickly and efficiently.
Furthermore, the Biztrak Online Dashboard allows customisation, enabling users to personalise the displayed information based on their specific needs and preferences. It also offer drill-down capabilities, allowing users to explore detailed data behind the summarised metrics for further analysis.
Overall, the Biztrak Online Dashboard plays a crucial role in providing a comprehensive and accessible view of financial information, empowering users to monitor, evaluate, and manage the financial aspects of their business effectively.

